 nathan leclaire
Improving Observability and AIOps with Smarter Sampling
In the field of financial machine learning, López de Prado has a paper, The Volume Clock, where he talks about sampling observations for model training based not on the mere ticking of the clock, but rather when information actually arrives to the market. For instance, bars might be generated when enough dollars or shares have changed hands instead of every N units of time.
I submit that a similar operation could be applied in DevOps to make sampling smarter and potentially to obtain better results in machine learning use cases for operational telemetry ("AIOps", if you will).
Better Bars
As it stands today, many of you sample or aggregate your production data somewhat haphazardly. In the case of distributed tracing, often a sampling decision is made randomly at the root of the call tree, and propagated around to descendants, resulting in 1/N traces being sampled. Meanwhile, with metrics systems such as Prometheus, metrics are gathered according to a predefined interval (15 seconds is a common default), and as they age, aggregated or “smooshed” further by replacing their raw values with averages. This allows teams to manage the operational burdens (including cost) that would otherwise be infeasible, but it has a big tradeoff too – you might not have the exact right data available when you need it. Production mysteries will continue to plague you, and most teams find themselves on a tightrope walk trading off ever-increasing monitoring costs and the stress of not being able to definitively answer questions about what’s happening in production.
But since I came across the concepts introduced in The Volume Clock and related work from de Prado, I’ve had a few fresh new ideas how you might be able to do this. To catch you up on the relevant ideas from de Prado, he examines novel approaches to generating “bars” such as you might see in a stock technician’s candlestick chart from the underlying tick (trade) data. Almost every data feed offers the traditional “time bars” where you can visualize the open, high, low, and close price traded for that interval over time, but despite their ubiquity, such bars are not ideally suited for machine learning (which is de Prado’s main concern). An example of daily time bars is shown below.

It is well known that financial data in general is not independent and identically distributed, as each observation is influenced by its predecessors, and the distribution of returns tends to be highly leptokurtic (i.e., it has fat tails – “risk happens fast”). Time bars exacerbate this problem because they bundle up too much information in one observation rather than emitting observations as new information arrives.
Other ways of generating your training data, that try to get you closer to your goal of IID therefore have both theoretical and empirical support. From the linked article:
Similar to other alternative bars (tick and volume bars) the overall auto-correlation is lower in imbalance bars than in traditional time-based candlesticks. As we explained in the original article, this is a good feature because it means data points are more independent of each other.
Most straightforwardly, preprocessing raw trade data into these alternative bars takes the form of emitting a new bar when a certain amount of volume has occurred, such as when N shares have changed hands, or N dollars have. Most of the action in trading, for instance, hovers around the open and the close of the exchange for the day. It makes sense to emit more bars in those times, where more information has arrived than during the middle of the session when everyone is out to lunch and little is happening.
The algorithm to do so is along these lines:
cumulative_dollars := 0
for tick := range ticks {
    cumulative_dollars += tick.shares * tick.price
    if cumulative_dollars >= NEW_BAR_THRESHOLD {
        emit_new_bar(open_datetime, open, high, low, close, volume)
        cumulative_dollars = 0
    }
    // update OHLC...
}
This will result in far more bars when something’s actually happening. There are fancier techniques too, but this illustrates the general idea and tends to result in bars that have more desirable statistical properties.
What if we could do something similar in observability to improve our sampling efficiency?
To Observability
Dollar bars work partially because they shift the lens to focusing on what you actually care about, i.e., money exchanged and new information, not the ticking of the clock. Can we apply similar operations in observability to get better results? I think so. For instance, let’s look at sampling tracing data.
One of the features in Honeycomb’s Refinery, a proxy for sampling distributed tracing data before sending it to a storage system, is the introduction of novel sampling methods such as dynamic sampling that improve on grabbing traces randomly. In dynamic sampling, the sampler maintains a map of how often it has seen a particular value of a span field, and samples more frequently seen values more aggressively, resulting in a “compression” of sorts that keeps more of the novel data such as failure states, and assuages the concern that we might not have what we need when we go to look for it.
For instance, a common key to sample on is the HTTP status code. Your service hopefully serves up a lot of HTTP 200 status codes, and very few 500 level status codes indicating an internal server error. Instead of capturing 1/N of both types, we can track how often they occur and sample a lot more of the 500s, relatively speaking.
That’s a good improvement over sampling randomly, but the idea of sampling relative to value, like the way that dollar bars work, has me wondering if we can push it much further. For instance, unlike sampling dollar bars, it does not relate directly to the underlying value or cost associated with the traces it’s examining.
We have a lot of different ways of measuring such value, and a few come to mind that might be useful.
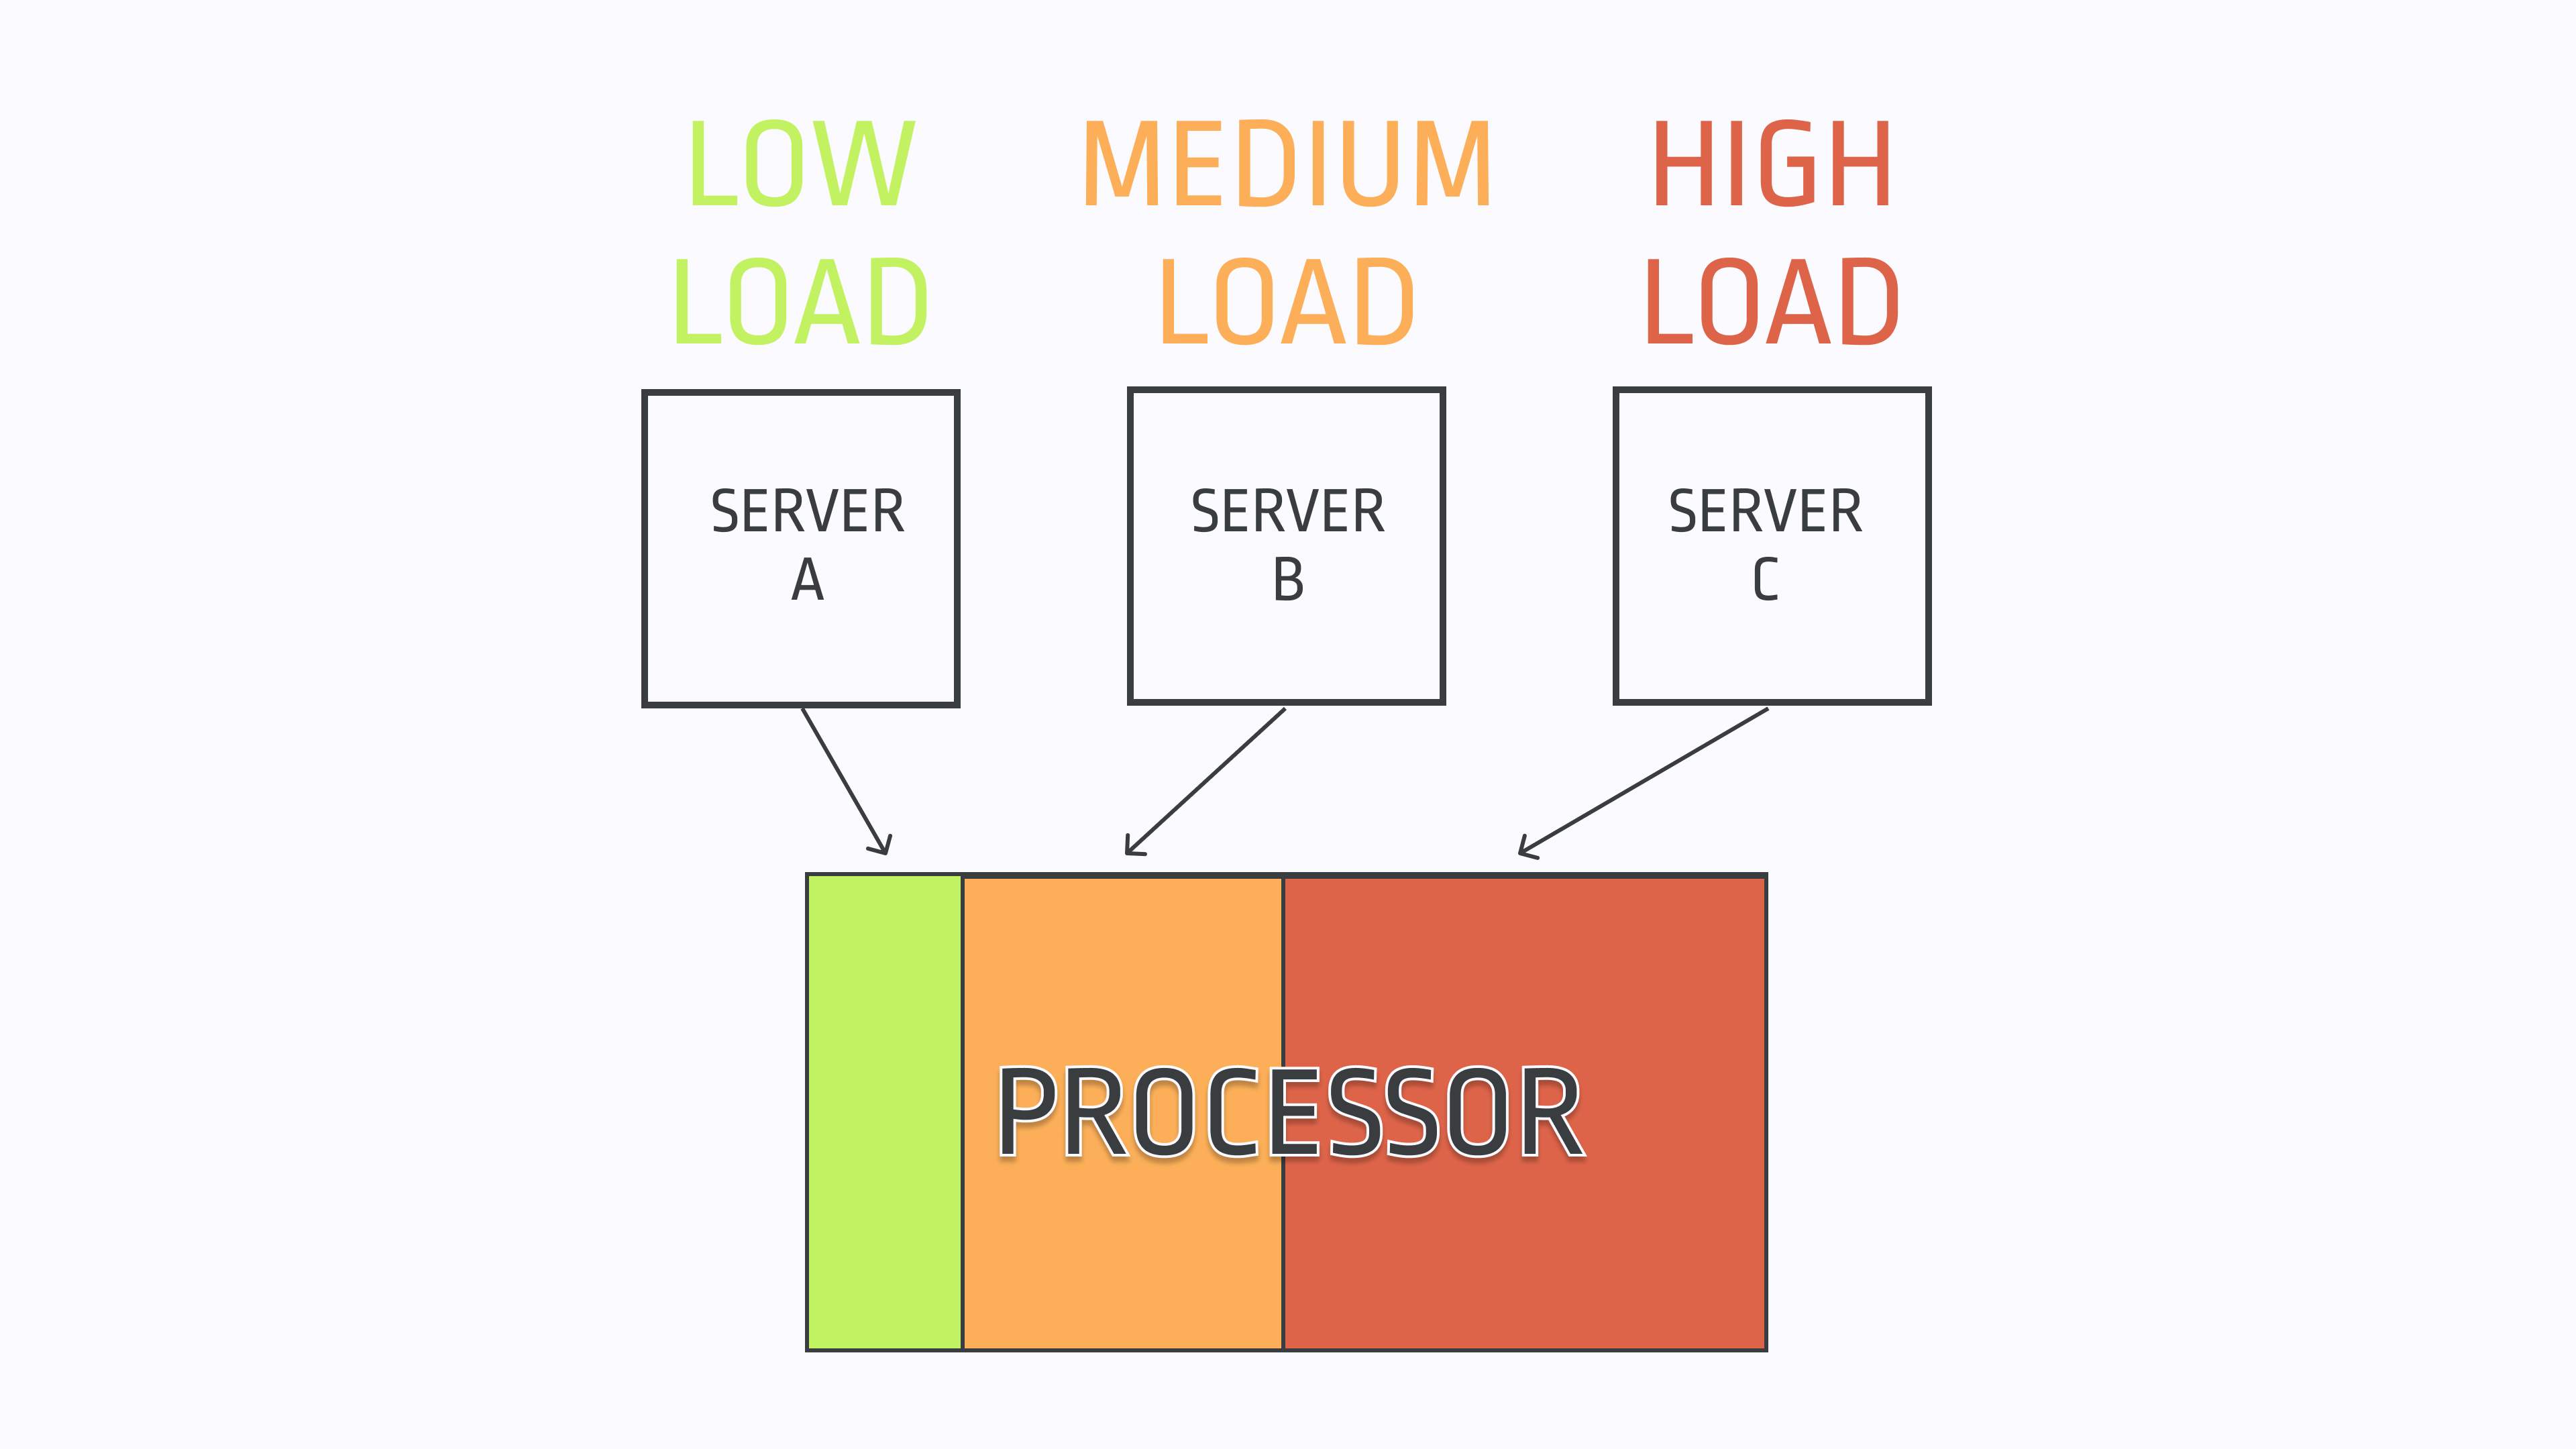
Sampling based on resources used – For determining which traces to store, you could examine the compute resources used nearby the trace in question, and sample more aggressively when the trace looks likely to be costing you more money. You may not be trading dollars for stocks, but you are trading dollars for compute resources, and oftentimes the source of a problem that vexes you will have clear signals that something is going wacky like elevated CPU, network, or disk usage.
This is most obviously expressed in the infrastructure metrics that almost every team has available measuring usage of CPU cycles, bandwidth, IOPs and so on. For instance, you could sample more frequently from a given host when its free memory is lower, or when its CPUs are burning hot. That should result in you having more relevant information at your disposal since you’ll be more likely to collect telemetry when resource utilization is strained.
Sampling based on the value of the underlying customer – Not all customers are created equal. Some actually have negative value for us (perhaps they are on a Free tier with no hope of ever upgrading), whereas some represent $XY,000,000 per year contracts. While not as straightforward as a metrics-based method as outlined above, it could reflexively help solve the fear of losing out on important telemetry. Almost by definition, at the end of the day we want to keep data that is worth a lot of money to our company, and ignore data that is worth less.
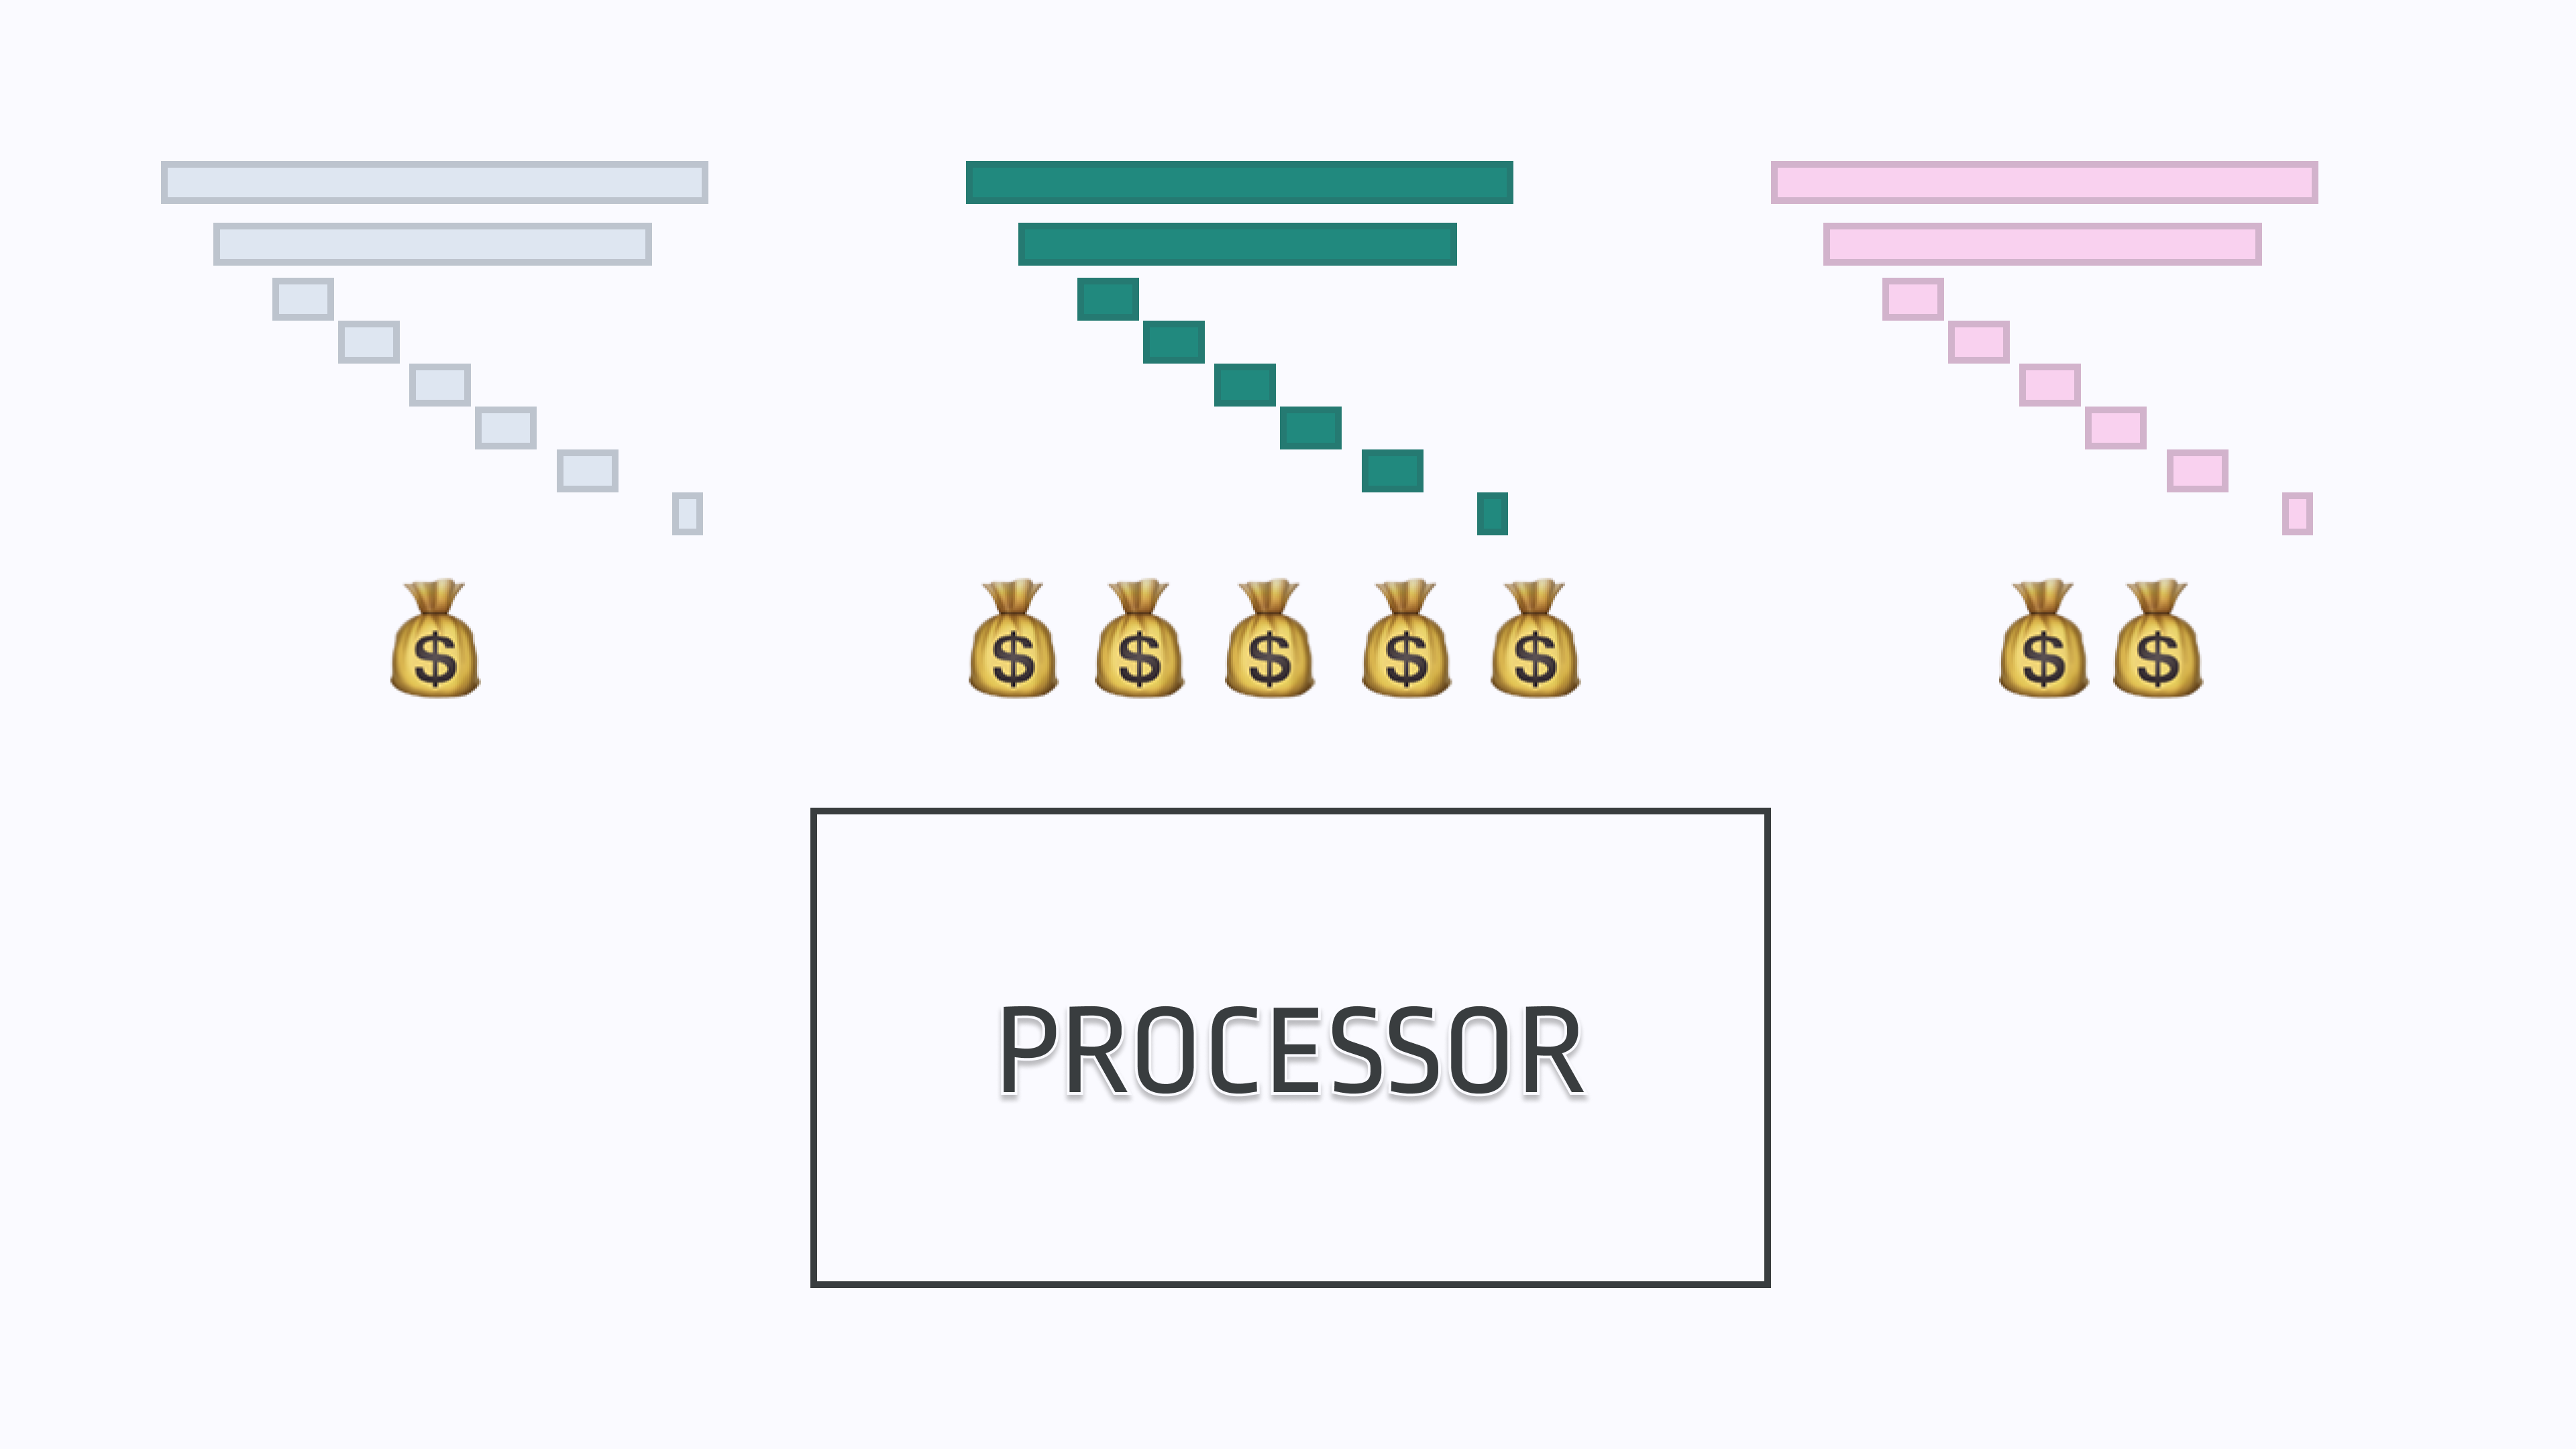
Perhaps someone out there is crazy enough to experiment with ideas such as attaching the Opportunity Amount from Salesforce (representing how much $ the customer is projected to be worth) to their tracing data and sampling based on that. You can even imagine yet more sophisticated systems that do projections and factor in yet more dimensions to the mix such as the users' value as an evangelist based on their number of Twitter followers, how important their title looks on LinkedIn, etc. While we all like to feel like we’re the most important, I’m sure you will agree that fixing a bug seen by a CTO with purchasing power or a Twitter celebrity is more important than patching issues encountered by some rando.
Sampling based on excess usage of “operational capital” – Of course, underlying resource usage or customer value are only a few obvious dimensions through which we can implement the idea of “value based sampling”. You could probably argue that, say, slow requests also use up our “operational capital”, by both frustrating users and sometimes directly impacting the bottom line. When I was at Honeycomb, we even encouraged users to codify this way of measuring impact as SLOs. Perhaps we could sample more frequently when we’re deviating from the our baseline “budget”?
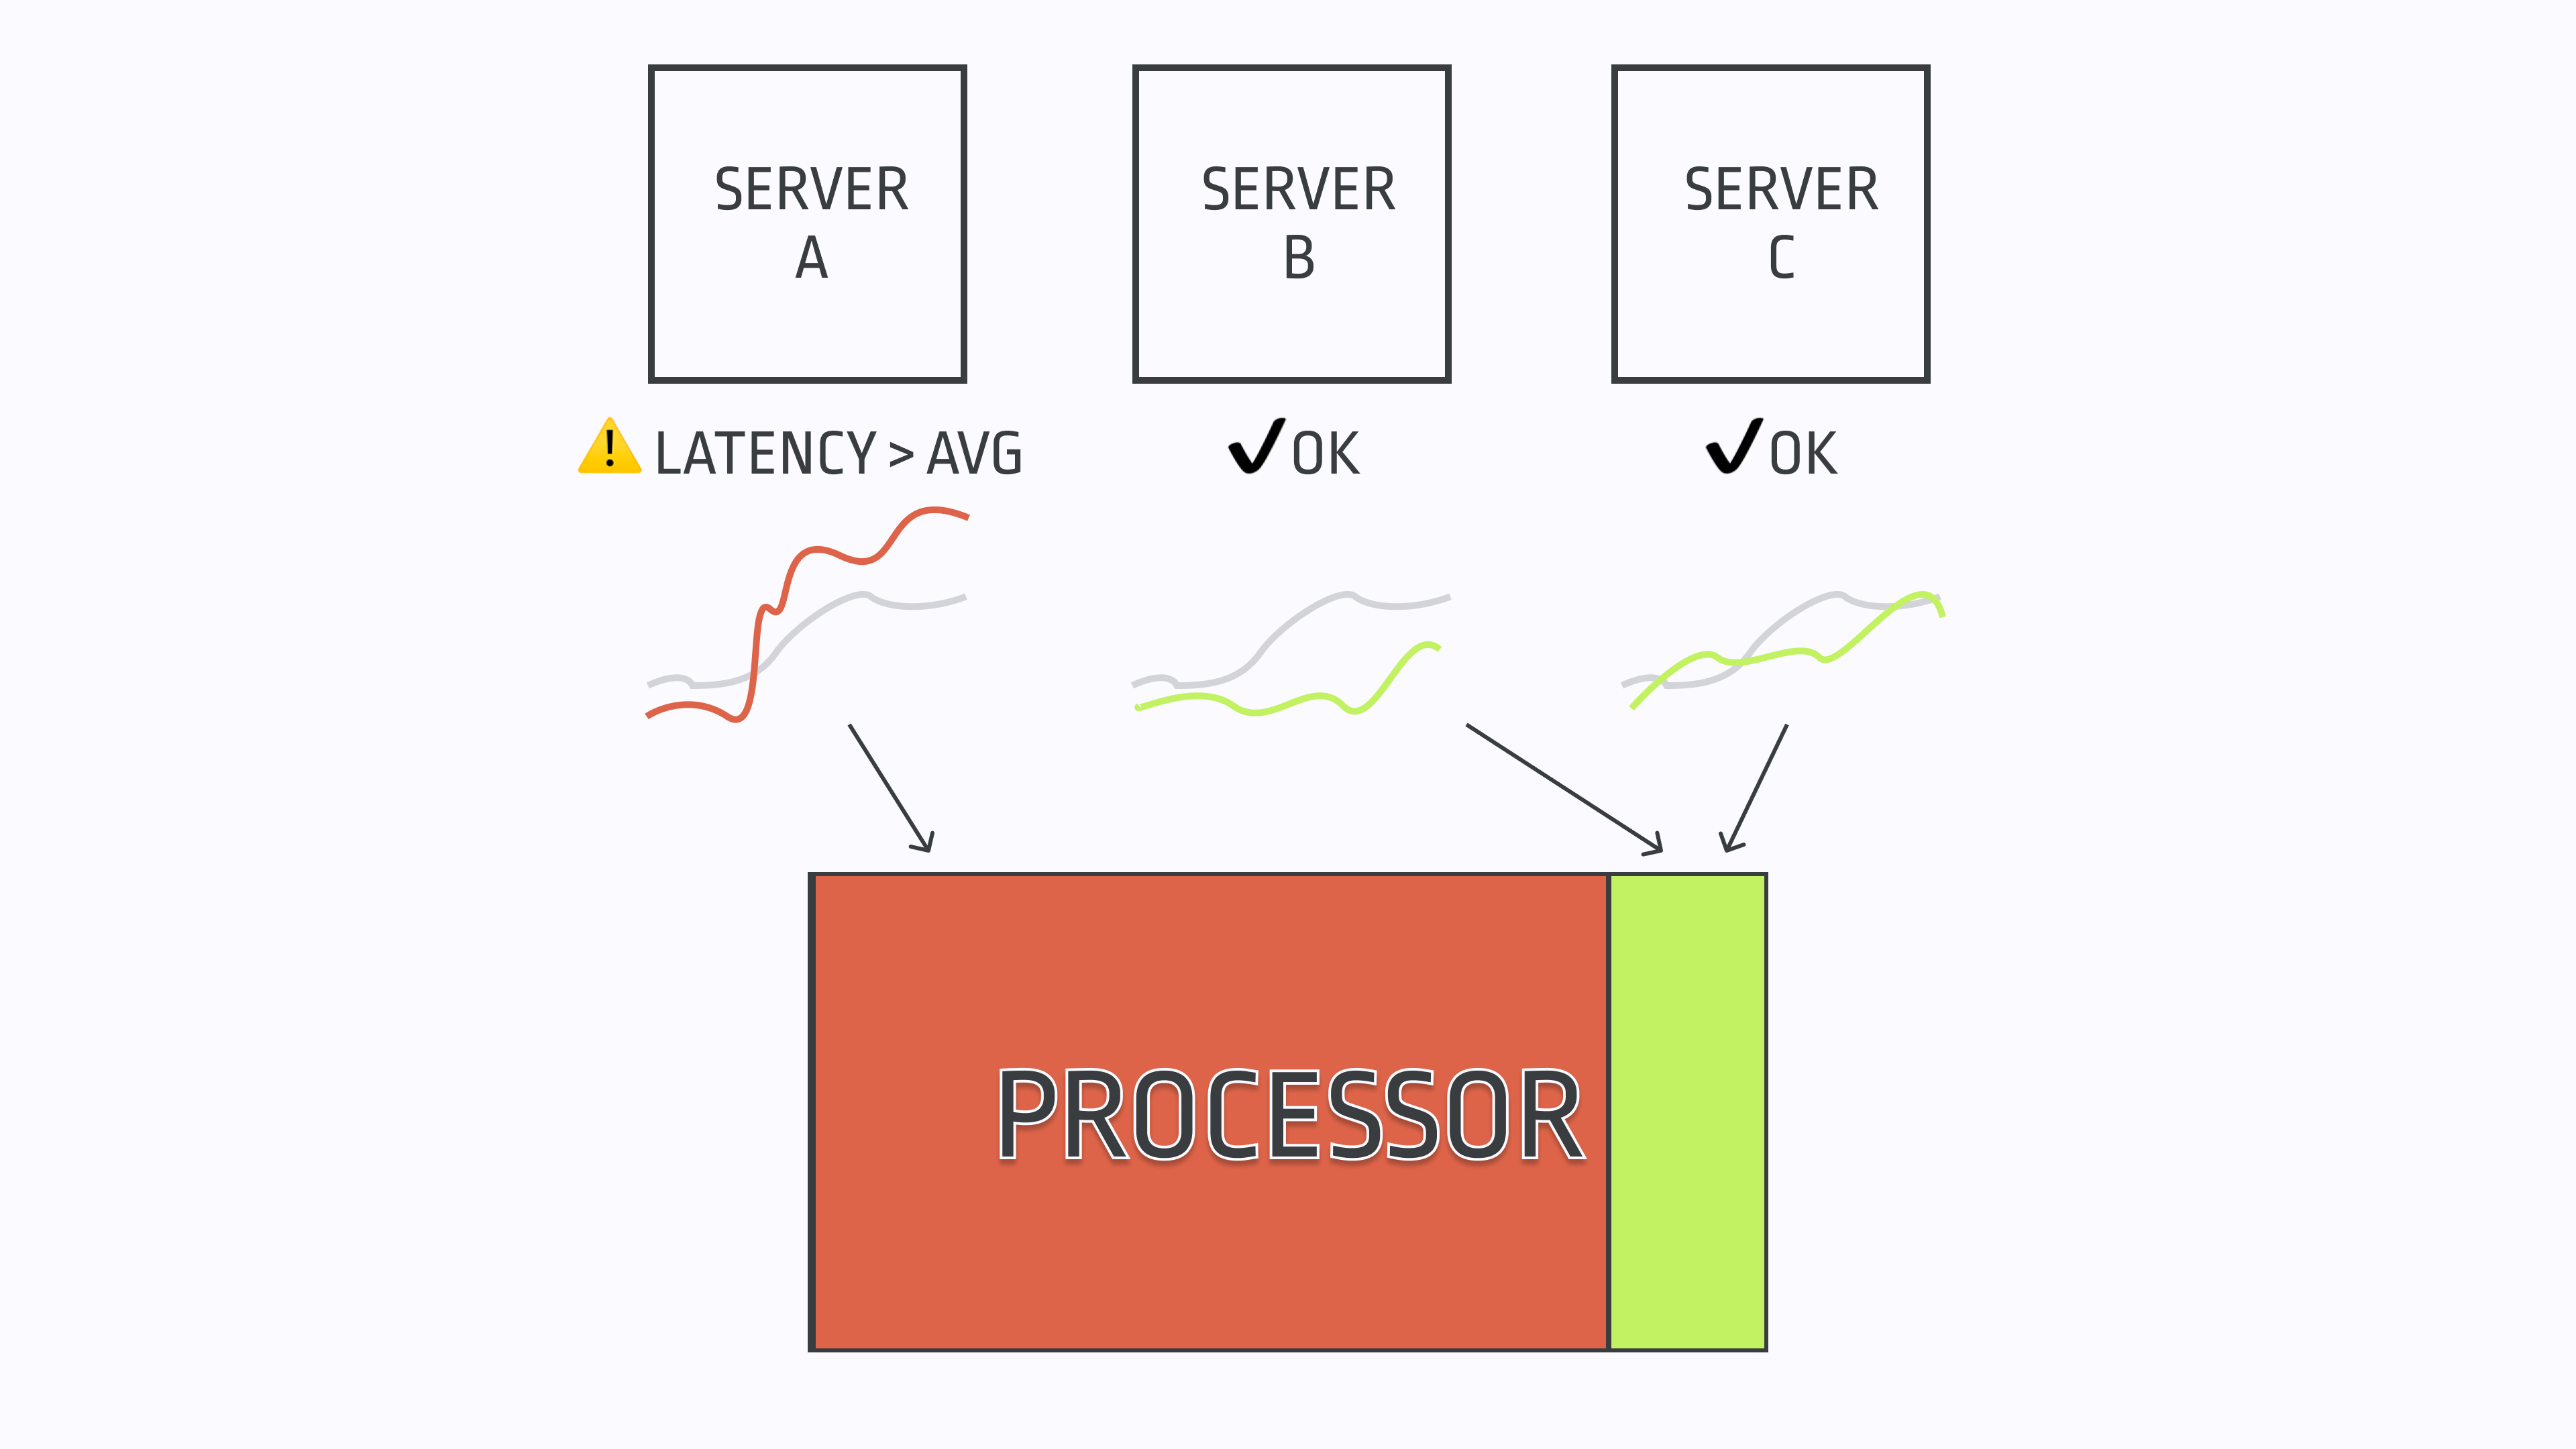
In de Prado’s work some of the more sophisticated bar sampling techniques deal with information imbalance – trying to sample when a time series has sufficiently diverged from past history in order to detect large traders who are splitting their orders up. The current EMADynamicSampler in Honeycomb’s Refinery is a first step towards this direction – it will sample traces more aggressively when the count for a particular value of a field diverges from its exponentially weighted moving average, i.e., when it’s abnormal. Think a sudden burst of HTTP 500 level errors when previously there weren’t too many happening concurrently.
This improves on the core dynamic sampling approach but could be extended beyond categorical fields. For instance, you could sample more aggressively when the value of the latency of a request diverges from its expected value based on the service and endpoint. You could sample more aggressively when you detect that a service is burning through its SLO error budget at a rate that’s quicker than the historical average. And so on.
The Future
I’ve focused on tracing above since it’s more or less what I know best, but I see no reason the information-centric approaches couldn’t be applied to metrics, logs, APM and more. For instance, why are you limited to a static time based scrape interval for metrics systems? A lot can happen in fifteen seconds, and while we don’t want to overload a host that’s already wheezing along with excessive scrapes, perhaps we could collect telemetry more dynamically based on an evaluation of where the problems are likely to be. We could even consider launching probes, such as the kind that eBPF offers, on the fly when our system realizes that useful information is being generated in a particular hotspot.
Then, when we inevitably search and visualize it later on, our tools would have a better head start in terms of surfacing the information that we actually care about, instead of simply painting us a time based picture that often leaves us scratching our heads and wanting more.
Likewise, doing machine learning on observability data has a lot of the same issues that doing it on financial time series data has. The data is noisy, it is not IID, and it is usually not generated in a way that’s focused on preserving information efficiency (though at least your “opponents” in observability are not trying to hide their tracks like they are in finance). Hopefully, most of the time in your production systems you are not having some critical issue or a prelude to one that would be useful for a model to pick up on and surface to you. If that’s true, then sampling data uniformly would be a mistake.
Instead creators of AIOps systems should look for ways to generate training data that is closer to IID and preserves the right information. That will lead to higher precision down the line, and consequently, lower fatigue with automated alerts or insights.